By Mark Wright, OD, FCOVD,
and Carole Burns, OD, FCOVD

July 14, 2021
It’s common to hear ODs speak of the lifetime value of patients. However, it may be more useful to think in terms of the lifetime value of patients in relation to the family each comes with. Here is how to calculate that value.
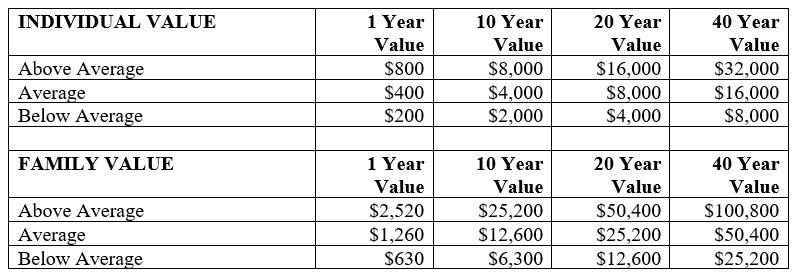
First, what is the annual value of an average patient? The average gross revenue collected is $400 per year per patient. So, what would that be for 10 years? The math is $400/year x 10 years = $4,000. For 20 years, that number would be $8,000. For 40 years, that number would be $16,000.
Patients do not usually come to the practice alone. They tend to bring their families with them. So, we should also consider the family value to the practice. To get to the family value we need to know the average number of people in the average family. For the most recent data we have, 3.15 is the answer.i To calculate the one-year family value for 10 years, the number would be 3.15 x $4000 = $12,600. For 20 years, the family value number becomes $25,200. For 40 years that is $50,400.
Now, the interesting concept is that not all patients are average. A good way to think of this is to divide patients into three categories: above average, average and below average. Let’s assume that the above average patient brings in $800/year, the average patient brings in $400/year, and the below-average patient brings in $200/year. The chart below shows the results for both individual and family value.
To make the numbers really interesting, what if we consider that patients refer people to the practice at different rates. Let’s just take the average person. Here’s what the math looks like for the average person who for just five years refers a modest two people to the practice per year who also refer a modest two people per year to the practice.
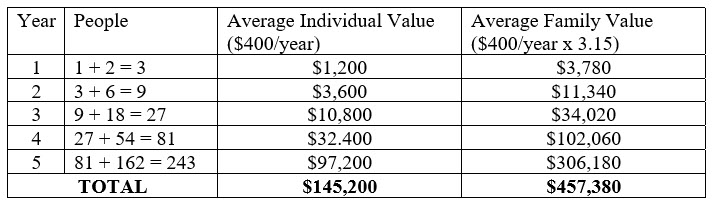
(Year 1, 1 person refers 2, so there now 3 people that year; Year 2, 3 people each refer 2 so 3+6 = 9 people that year)
Remember that people tend to refer people to the practice who are just like themselves. So, the chart above is just the difference one average person makes.
Our take-home message from this exercise is to recognize the value of patients coming through the practice. We don’t just think about each individual, but we also think about their family (who come to the practice because they do) and the extended reach that each patient can have.
Other Articles to Explore
The Spectacle Lens System Helping Me Achieve a 77% Year-over-Year Optical Revenue Increase
How Understanding Patient Health Concerns Changes the Dynamics–and Growth Potential–of Your Practice
Your action plan for this week is to redo the charts above with the actual numbers from your practice. Then, consider what systems you can put into place to enhance the value of patients coming through your practice.
If you want to take this exercise to the next level, then redo the charts focusing on profit rather than gross revenue collected.
References
i. Average family size in the US 1960-2020 | Statista