By Thomas F. Steiner
Review of Optometric Business
 Director of Market Research,
This is the first of a three-article ROB series that breaks down each of the benchmarks featured in VisionWeb’s e-book, 8 Benchmarks ODs Need to Monitor in Their Practice, and presents normative data drawn from the Management & Business Academy (MBA), a research program sponsored by Essilor, along with suggestions for how your practice can meet each benchmark if you fall behind the industry average. The MBA database includes aggregateperformance data from more than 1,800 US optometric practices. It has published the most comprehensive compilation of benchmarks currently available. You can visit mba-ce.com to access the MBA metrics research.
SYNOPSIS
Manage effectively by tracking critical practice performance metrics. Begin with the most important ones.
ACTION POINTS
MEASURE TO MANAGE: Know if your practice is profitable or not.
TRACK OVER TIME: Metrics that are tracked tend to improve.
CONCENTRATE YOUR ENERGIES: Begin by tracking and improving most important metrics–and making improvements.
One of the most important management tasks in any eyecare practice is routinely tracking practice performance. Keeping a close eye on key metrics can reveal the successes, failures and opportunities. As CEO of your practice, you need to be on top of the financial health of your practice, and take corrective action to improve the areas of your business that may be falling behind compared to others. This is where key metric monitoring comes in.
VisionWebproduced an e-book, authored byGary Gerber, OD, of the Power Practice;and Steve Sunder of VisionWeb, that includes eight key metrics deemed the most helpful in measuring the performance of independent optical practices. Their eBook, 8 Benchmarks ODs Need to Monitor in Their Practice, comes with a downloadable excel sheet that does all of the math for you! The eBook can be downloaded HERE.
DOWNLOAD COMPLIMENTARY E-BOOK:
Metric 1: Revenue per Patient
Revenue per patient is calculated in a few different ways, depending on if you want to determine revenue per comprehensive exam patient, or revenue per all patients (including medical eyecare treatment patients). Let’s take a look at both formulas below:
The Formula: Gross Annual Revenue / # of Annual Exams Performed = Revenue/Patient
*MBA Example: $659,736 / 2,156** = $306
OR
The Formula: Gross Annual Revenue / # Total Patient Visits = Revenue/Patient
MBA Example: $659,736 / 2,598*** = $254
The national performance of ODs on this metric is very slowly increasing, through inflation and the gradual increase in dispensing of new technology products. On top of that, there is considerable variation in gross revenue per exam across practices. The most productive 10 percentof practices see revenue per exam nearly two thirds higher than the median (see table below).
*MBA example numbers are based off MBA norms. MBA has not directly measured gross revenue per medical eyecare visit, but available data suggests that the average revenue per medical eyecare visit is roughly comparable to that from an eye exam visit.
**Assumes 1.1 complete exams per hour for ODs working 1,960 hours annually (49 weeks at 40 hours per week).
***Assumes 2,156 complete exams and 442 medical eye care visits (17 percent of total visits).
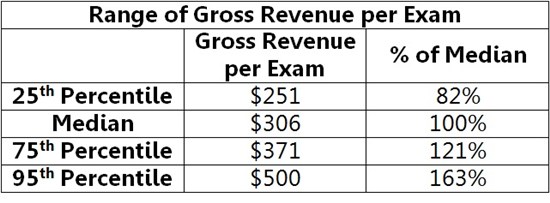
Editor’s Note: Shown above in the chart are MBA norms: The median is $306, but the goal to aim for is the higher amount achieved by the75th percentile of all OD practices in the database. The highest percentile achieves an even higher revenue figure.
Improving Your Gross Revenue per Exam
If your practice is falling below the median, there are opportunities to increase revenue per exam with little or no cash outlay through office practice changes. Many variables can impact gross revenue per exam, but ODs should focus on the following to help increase revenue per exam:
• Average eyewear sale/dispensing ratios for premium lenses and frames
• Eyewear capture rate
• Professional fees
• Eyewear retail pricing
• Multiple eyewear purchase ratio
Metric 2: Revenue per Staff Hour
Monitoring revenue per staff hour will help you evaluate the efficiency of patient management by your staff, and can signal if your office is over- or under-staffed. The median staff hours and revenue in this calculation can vary depending on the time period you want to measure. Here we look at annual hours and revenue, but you could also measure this on a monthly basis.
The Formula: Gross Revenue / Annual Median Staff Hours = Median Revenue/Staff Hour
MBA Example: $659,736 / 7,949**** = $83
****Equivalent to four full-time staff members.
Revenue per staff hour is weakly correlated with practice size, and the norm for this benchmark hasn’t changed in over seven years of measurement! Sixty percent of practices have a revenue per staff hour ratio between $70 – $100. If you’re getting a revenue per staff hour over $100 you should review your workflow and determine if staff additions would improve patient service. On the other hand, if your practice is suffering from a low performance on this benchmark, it could be from:
• Over-staffing
• Low revenue per complete exam
• Active patient base too small to support staff
• Staff hours to OD hours ratio of five or more – indicative of an inefficient patient service process
The next article in this series will discuss eyewear capture rate and frames inventory turnover.
Thomas F. Steiner, Director of Market Research for ROB, has spent more than 25 years helping eyecare practices succeed, including pioneering the introduction of color contact lenses into optometry. To contact him: tnlsteiner@comcast.net