Sponsored Content

Key Metrics Management
Dec. 18, 2019
By Susan Keene, OD
I began practice with the expectation that I would provide clinical care on a full-time basis. Opportunities arose to become a practice owner, and I found that I very much enjoyed the business aspects of optometry, in addition to providing clinical care.
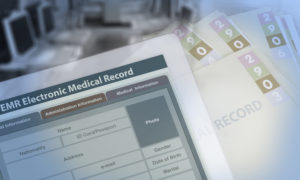
As I grew one office and acquired several others, tracking performance metrics became an essential part of the increasingly complex management process. Now, with three locations and plans for a fourth, the EDGEPro by GPN Technologies has become an essential management tool. It is integrated into OD performance, with compensation tied to an objective accounting of individual performance. And it is integrated into team performance, as well.
KEY METRICS THAT MAKE A DIFFERENCE
Revenue per patient
Our revenue per patient is up 18 percent through the third quarter.
Premium lens options
Our AR is at 80 percent capture rate
Our Transitions is at 48 percent capture rate.
Contact Lens Dailies
Single-use contact lenses are 50 percent of all contact lenses we dispense.
I really don’t understand how a practice can stay on top of what’s going on without a dashboard system. As we consider adding a fourth location, our concentration is on implementing management efficiencies that would work as well with six or seven locations as with the four we have in mind. My only regret is that I didn’t rely more on dashboard systems in our initial expansion to smooth out some of the chaotic moments that we’ve experienced with high growth.
Manage in a Professional Manner with Data
Today, a continuous focus on metrics tracking allows me and my administrator to manage in a far superior and professional manner. Regular performance reviews, along with working sessions on how to make performance improvements, provide a huge step up from the seat-of-the-pants style of management that young ODs face all too often as they enter practice.
Associate ODs often face arbitrary performance measures, along with “moving goal posts” expectations, that can sour them on independent practice.
Dashboards Sort Out Perception & Reality
Dashboard technology helps us to manage based on numbers, and numbers have no emotions. In all our locations, we promote the health and convenience advantages of daily-disposable contact lenses. I mentioned this to a sales rep recently, saying that two-week replacement lenses were a thing of the past, something that probably accounted for just 1-2 percent of our lens sales.
Wrong, I was! I checked and found that 18 percent of our contact lens orders were for two-week lenses. Our system sorted out my emotional perception (I thought I was steering everyone into dailies) from the cold, hard numbers. And it showed us where there’s room for growth and improvement—and where our ODs (including me) need to strengthen recommendations.
Dashboards Reflect Differences Between Locations
When we added a second location, we initially saw that as a satellite office, staffed full time, but with ODs in place only two days a week. However, with data-driven management, that “satellite” grew rapidly and eclipsed our “main” location.
The key growth driver came when we identified a demographic need of medical eyecare that was not being offered. We’ve collaborated with local MDs to provide diabetic exams, among other services. We expanded that to specialize in dry eye and meibomian gland disease management, offering Lipiflow and scleral contact-lens fittings.
We maintain separate dashboards for each office since patient bases and demographics differ. But we consolidate all of our data to identify points of efficiency now and into a future that could include even more locations.
Our EDGEPro dashboard is set up to total all three offices together, but with one drop-down menu we can separate the information by location.
Dashboards Help to Set Compensation Models
While we rely mainly on our dashboard to track performance numbers and compute profitability, we also use them as training and managing tools. We use data in the on-boarding process with new associate ODs. We set an initial compensation base plus performance. We track this from the start and evaluate it at six and 12 months.
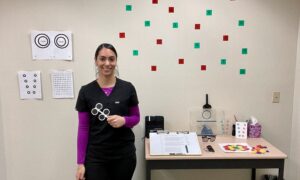
Practice Profile
Marion and Cedar Bluff, VA; Bristol, TN
www.envisioneyeva.com
Locations: 3
ODs: 7
Staff: 50
Administration: 3 office managers, 3 administrators
Services: Full-scope optometry, specialty services
With our dashboard systems, we have transitioned our professional staff to performance-based compensation. The advantage, again, is that numbers are devoid of emotions, which often cloud compensation discussions. We make it clear from the start that we use objective data for reviews, goal setting and improvement targets.
Dashboards Identify Problems & Show the Where and Why
In business, there always are upturns and downturns, and an optometry practice is no different. For example, personnel come and go, we add a new associate or purchase new or upgraded diagnostic equipment. All of these factors show up in the numbers. Sometimes, they slow growth or impact profits, but that’s not necessarily a bad thing.
I don’t mind bad numbers as long as I understand why they occur. Having a dashboard shows me immediately where the problems originate, and this points to solutions that provide long-term growth.
Adding new diagnostic equipment is a case in point. We added the LipiFlow system for dry eye treatments at one location, and this cash-only procedure has boosted profits there significantly. But it doesn’t make sense to add the system at all locations. We can refer patients from one office to the one with the system, and patients will travel 30-40 miles for this one-time treatment then return to their home office for continued care.
More Success Stories
We’re taking a look now at adding aesthetic optometry services, with an Intense Pulsed Light (IPL) system, again not in all locations, but in one initially. Surely, if we add the system, we will track growth and ROI from the start.
Perhaps best of all, having a dashboard system allows me to practice in the manner I most prefer: I see patients two days a week, visit practices for management reviews two days, and have Fridays off. For me, it is managing smarter, not harder.
 Susan Keene, OD, owns Envision Eye Care and Dry Eye Clinic, with three locations in Virginia and Tennessee. She is past president of the Virginia Optometric Association. Contact: drk@envisioneyeva.com.