By Mark Wright, OD, FCOVD,
and Carole Burns, OD, FCOVD

June 29, 2022
Jobson Business Tracker shows trends for key practice metrics over the last few years. Here are the trends these numbers reveal, and what to do to make a strong practice performance for 2022 more likely.
There are a couple of different ways to look at the data. Just so you know, we prefer to start the analysis by looking at graphs rather than spreadsheets full of numbers. (For context, we often use spreadsheets to drill down on specifics after we’ve seen the big picture from looking at graphs.) We feel we can pick up trends faster when we are looking at graphs of the numbers.
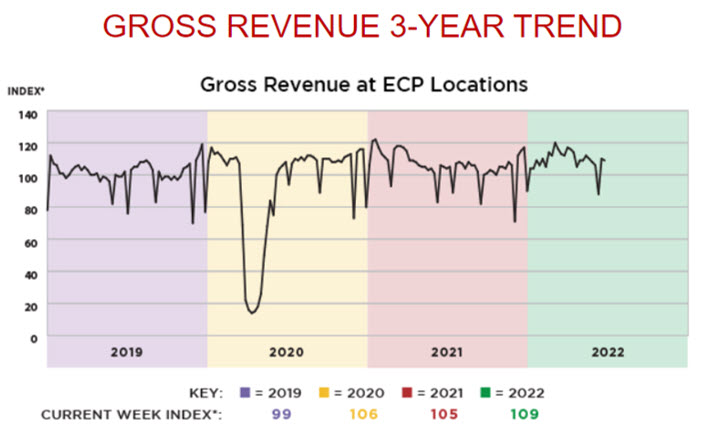
Let’s look at one key practice metric today (gross revenue) to analyze its yearly performance.
Here is one way that shows the annual data graphically end to end, year after year:
Here is another way that shows the same data, but it is laid on top of each other. For our purposes today we are going to focus on this type of data layout.
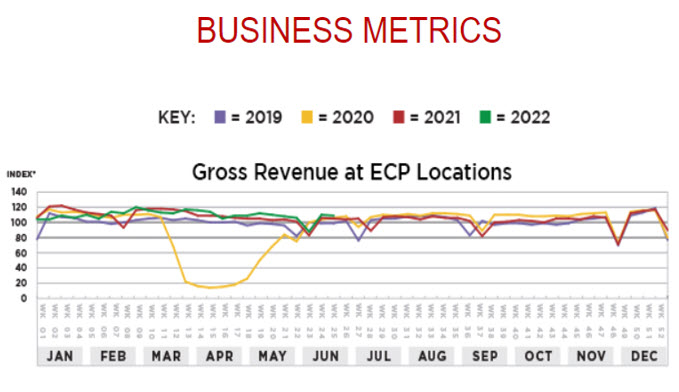
In this last formatting of the data, notice how similar each year is. Obviously 2020 stands out as an outlier, but the other years are quite similar. For our purposes, we are going to ignore the 2020 shutdown as a unique experience that we hope will not repeat.
Do this type of analysis for your own key practice metrics. This will help you in the following two important ways: staff scheduling and cash flow planning.
Staff scheduling. When you know the practice is going to have a dip in patient traffic, this is the ideal time to schedule staff vacations. Looking at the above graphs we can see that the end of school, the beginning of summer and end-of-year holidays have a dip year after year. With fewer patients coming in, could you use that time to get by with fewer staff?
Other Articles to Explore
Cash flow planning is an essential business planning activity. Paying bills when the practice is flush with money is never a problem, however, when less money is coming in, that can cause cash flow problems. It is important to plan for these problem times so that you do not find yourself scrambling to meet important bills such as payroll. (Keep in mind that third-party payments are 4-6 weeks after the service and products were sold.)
Back to the graph. There are two ways to handle the data. The most common way is fatalistic. You’re going to accept that this just reflects how things are going to go in the practice and keep doing what you’ve been doing while watching the same thing happen year after year. The other approach is to be proactive. You know that there is going to be a dip at the beginning of the year and at the end of the year, so what can you do to change that outcome? (Remember the Einstein definition of insanity?) Around holiday time could you run a Give the Gift of Sight marketing program? At the beginning of summer could you run a To Get Ready For Summer, Make Sure Your Eyes And The Eyes Of Your Loved Ones Are Protected marketing campaign? Get creative and see if you can change the trends to a more positive direction.
Here we sit mid-year. The rest of the year is in front of us. We know what the trends are from previous years. Which approach are we going to take: fatalistic or proactive? At the very least, start looking at your own practice data to see your yearly trends so you are making practice decisions from the position of knowledge.
Here’s our best advice to you: make a plan, then work the plan.